Key Points:
- Markets are showing a pattern of extreme calm followed by periods of extreme volatility.
- The last 30 years of stock market performance do not appear to be normally distributed.
- It is very important to be able to run scenarios on severe market downturns to stress test your investments and retirement plan.
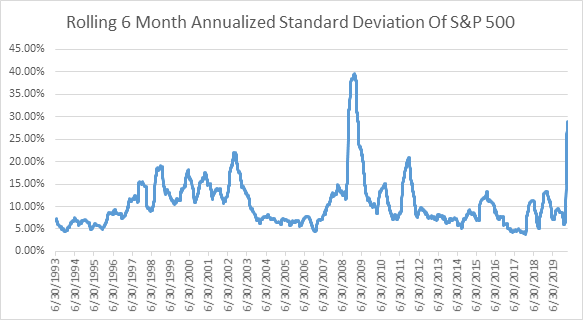
It goes without saying that the financial markets in 2020 have been incredibly volatile. Over the past 40 years, the standard deviation of the S&P 500 index’s performance has been about 15% on an annualized basis. In 2020, the standard deviation of the S&P 500 has nearly doubled to 29% annualized.
Obviously this type of volatility will not continue. But it does bring up several questions about our markets in general. First, has something changed in our financial markets such that we have years of calm periods followed by extreme volatility like we have had this year, 2008 through 2009, and 2001 through 2002? Are there certain segments of the stock market that have shown to be more resilient against this type of volatility? And lastly, how can we better model this volatility in the WealthTrace Planner?
Volatility Can Hit Quickly
It has been a hallmark of the financial markets over the past 30 years that several years of calm are followed by large spikes in volatility when a recession hits.

The chart above shows the rolling 6 month annualized standard deviation of the performance for the S&P 500. You can see the large spikes during the bear markets that started in 2001, 2008, and 2020. But notice the extreme levels of calm that existed in between these time periods. Stock market volatility hovered near only 5% for several years before the financial crisis of 2008/2009. After that, it didn’t take too long for volatility to plummet once again towards the 5% mark.
Very Few Places To Hide In The Stock Market
Treasury bonds have performed well this year as investors fled stocks to the safety of treasuries. An investment in a 30 year treasury bond at the beginning of the year would have returned about 20% so far this year, which has shown the value of being diversified among stocks and bonds if you are near or in retirement.
But in terms of stock funds, there have been very few places to hide. Right around the time the markets started to realize just how bad things were going to get with the coronavirus pandemic, I started tracking what is called a “minimum volatility fund”. These funds use a variety of strategies to try and minimize performance volatility. Some use a strategy of looking at earnings volatility while others simply track the rolling volatility of certain stocks and include the stocks that are at the lower end. I looked at the Vanguard Minimum Volatility fund to see how it has held up this year.
| Annualized Standard
Deviation YTD | Performance YTD |
| S&P 500 | 29% | -14.5% |
| Vanguard Min. Vol. Fund | 23% | -16.1% |
The Minimum Volatility fund has indeed been less volatile, but has performed worse than the S&P 500. These funds are relatively new so we will need several more years of data to make any serious inferences about them.
I also looked at the Dividend Aristocrats fund. This fund contains some of the most consistent dividend payers in the world, such as IBM, Cardinal Health, and Exxon.
| Annualized Standard
Deviation YTD | Performance YTD |
| S&P 500 | 29% | -14.5% |
| Dividend Aristocrats | 30% | -18.3% |
This has not been a good time to be in this fund. Not only has it been more volatile, but the performance so far this year has been quite a bit worse than the S&P 500. Most likely this is due to a slightly larger allocation to the energy sector, which has been hammered hard this year.
Handling Volatility Changes In Your Plan
It’s quite possible that after this bear market is over we will see volatility plummet once again to more typical levels. But if you believe that higher volatility is here to stay, you can control this in your financial and retirement plan.

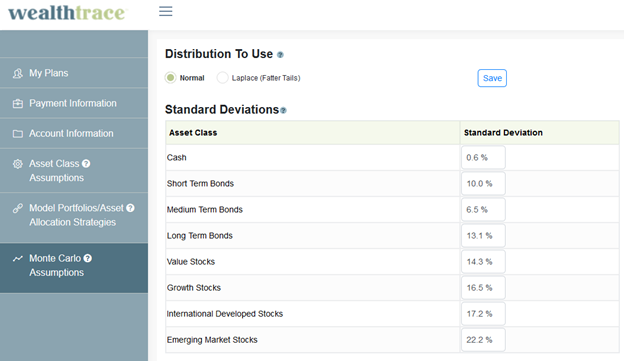
You are able to change the default settings for the Standard Deviation in the WealthTrace software. This will in turn impact your Monte Carlo results. Normally, the higher the volatility, the lower the Monte Carlo probability of plan success.
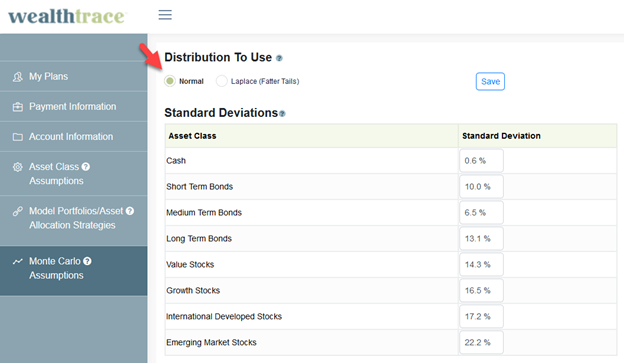
You can also change the distribution used for Monte Carlo analysis.

The default value for the distribution used in Monte Carlo is ‘Normal’. This is the typical bell curve we see in many randomly distributed variables. There is also another option for using a Laplace distribution.

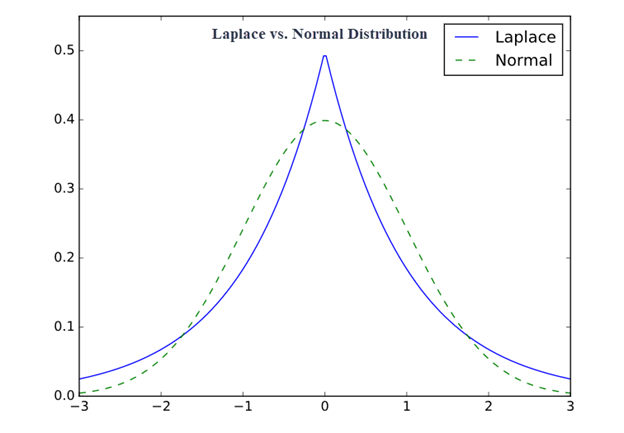
The Laplace distribution has “fatter tails” which means the probability of extreme events is higher than when using a normal distribution. What has happened in 2020 and in 2008/2009 can no doubt be classified as extreme events.
The data suggest that over the past 30 years, the distribution of stock market returns has followed more of a Laplace distribution than a Normal one. In a normal distribution, we expect 99.7% of the data to fall within 3 standard deviations of the mean. A monthly return that is 3 standard deviations from the mean can be considered an extreme event. For S&P 500 monthly returns, I found that 98% of the returns fell within this bound, which suggests fatter tails more akin to a Laplace distribution.
The real question is, will this continue? If you would like to change your Monte Carlo results to use the Laplace distribution, you can select it and run your results. Keep in mind that most Monte Carlo results will see a worse result than when using a Normal distribution.
We Will Always Have Bear Markets
We must all be prepared for market downturns and we should have an idea how much pain our retirement portfolios can take. I discussed in detail here how users of WealthTrace can use our Bear Market scenario feature to see just how bad market downturns could be for their portfolio and retirement plan.